Business reports and user reports
In the Reporting module, you can generate reports for phishing simulation campaigns and training & awareness campaigns. Reports are a great resource for verifying the effectiveness and value of your BullPhish ID campaigns.
In this article, business reports and user reports are described.
IMPORTANT Remedial training campaign statistics are not included user reports.
A business report includes campaign statistics for the modules (training, phishing) for which an organization has a subscription. Reports include data for in-progress and completed campaigns.
Business reports are generated monthly and quarterly. Monthly reports are generated the first three days of the following month and quarterly reports are generated the first three days of the following quarter.
The months included in each quarterly report are:
- Q1: January, February, and March
- Q2: April, May, and June
- Q3: July, August, and September
- Q4: October, November, and December
The type of information included in the monthly and quarterly reports is the same, the only difference is the time frame the data represents. The sections that comprise each report are described below.
01. Summary
The Summary section shows Phishing Simulation campaign statistics on the left side and Training & Awareness campaign statistics on the right side.
The Phishing Simulation campaign heading identifies the number of phishing campaigns that were conducted and the number of emails that were sent during the report time frame.
The Training & Awareness campaign heading indicates the number of training campaigns that were conducted and the number of trainings that were assigned during the report time frame.
Below each heading, the percentage for each status is conveyed. Statistics for the current time frame are presented in the top bar for each status, while the bottom bar shows results from the previous time frame. The amount the status has changed (percentage) from the last monthly or quarterly report is shown as well.
The legend at the bottom of the section indicates the months in the current time frame and the months from the previous time frame.
EXAMPLE Monthly business report example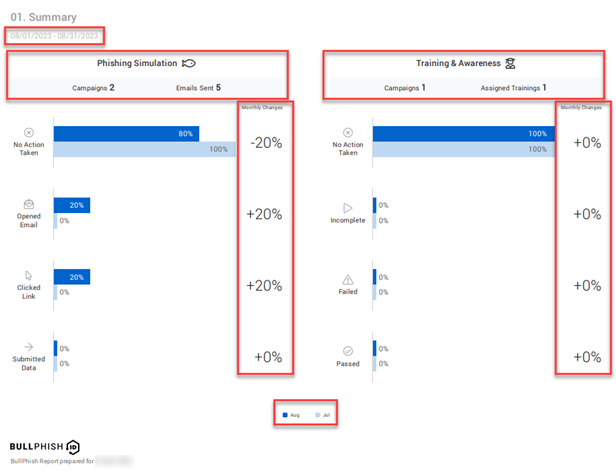
EXAMPLE Quarterly business report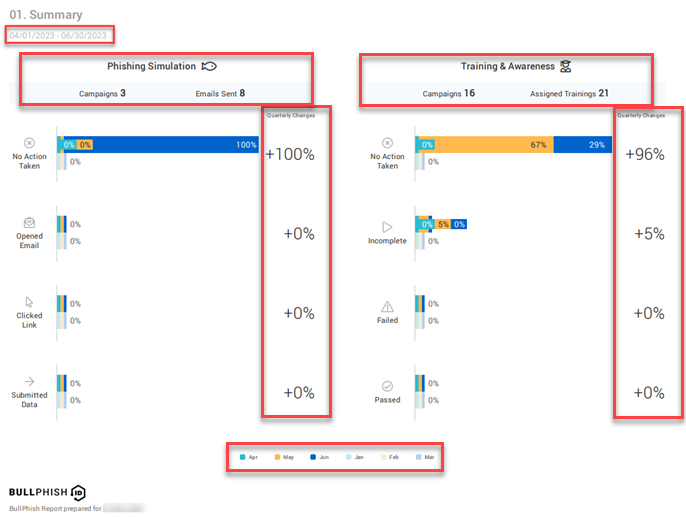
Status descriptions
The phishing status values are described below:
- No Action taken: Users did not open the phishing campaign emails they received.
- Opened Email: Users opened the phishing campaign emails but did not click any links (i.e., landing page link, attachment).
- Clicked Link: Users opened the phishing campaign emails and clicked a link (i.e., landing page link, attachment).
- Submitted Data: Users opened the phishing campaign emails, clicked the link to the landing page, and submitted data (e.g., login credentials).
NOTE On the phishing landing page, if a user clicks any link other than the submit button, the status of the clicked link is not tracked. The submit button is the only link tracked.
The training status values are described below:
- No Action taken: Users did not open the training campaign emails they received or users opened the emails but took no action.
- Incomplete: Users did not complete the training course.
- Failed: Users finished the training course but failed.
- Passed: Users finished the training course and passed.
02. Phishing Simulation Details
The data in the Phishing Simulation Details section helps your organization identify and measure the phishing attack vulnerability level within your organization.
In addition to displaying the percentage for each status, the graph identifies the number of users for each status, as shown in this monthly report example.
In this section, status statistics are broken down and displayed at the campaign level. The Campaigns column lists the campaign name and kit name for each campaign. Also, the groups for which the campaign applies are identified.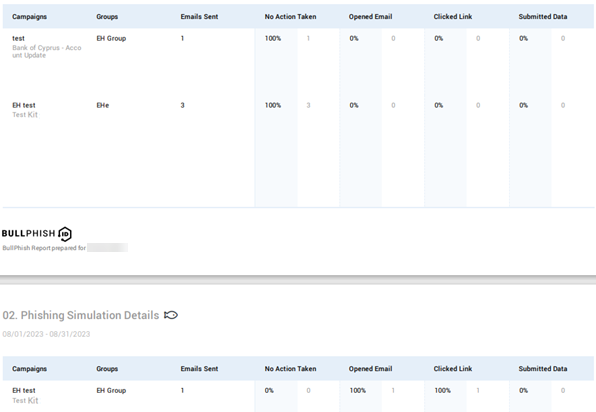
Section 03
To enhance the readability and efficiency of Section 3, the report version included depends on the number of actions taken by targets and the total number of kits sent within the report period.
- Phished Users: This version appears when there are 100 or fewer actions taken by targets.
- Phishing Kits by Risk Level: This version appears when there are more than 100 actions taken by targets and 150 or fewer kits sent.
Each version is described below.
Phished Users
The Phished Users version is included in the report when there are 100 or fewer actions taken by targets within the report period. In this version, the actions of each target are listed. The actions tracked are Submitted Data and Clicked Link.
NOTE Email Opened status is excluded.
The table includes the following data for each target:
- Name: Target's name.
- Phishing Kit: Full name of phishing kit in which the action was taken.
- Group: Name of the group to which the phishing campaign was sent.
- Email: Target's email address.
- Date: Date the target clicked a link or submitted data (credentials).
As indicated in the upper-right corner of the section, table entries are sorted by the severity of the actions taken, with Submitted Data being the most severe action followed by Clicked Link.
The section footer includes the name of the organization for which the report was created. In addition, it contains a statement emphasizing the report contains confidential information and unauthorized use is strictly prohibited. Each report is generated at midnight UTC.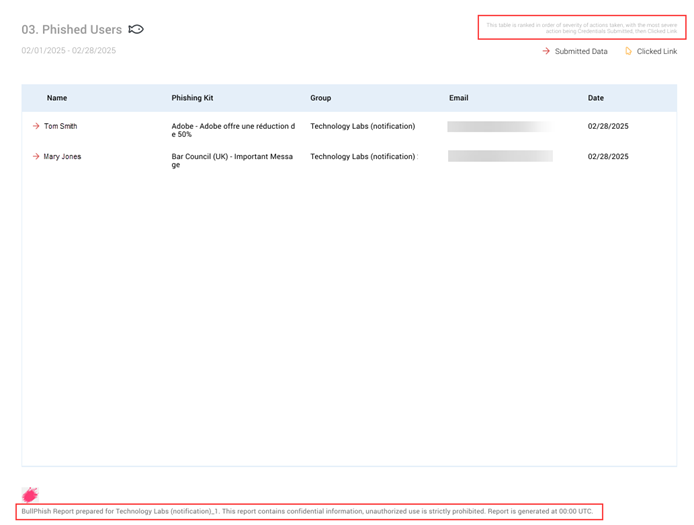
NOTE The sorting criteria and footer information apply to each Section 3 version.
Phishing Kits by Risk Level
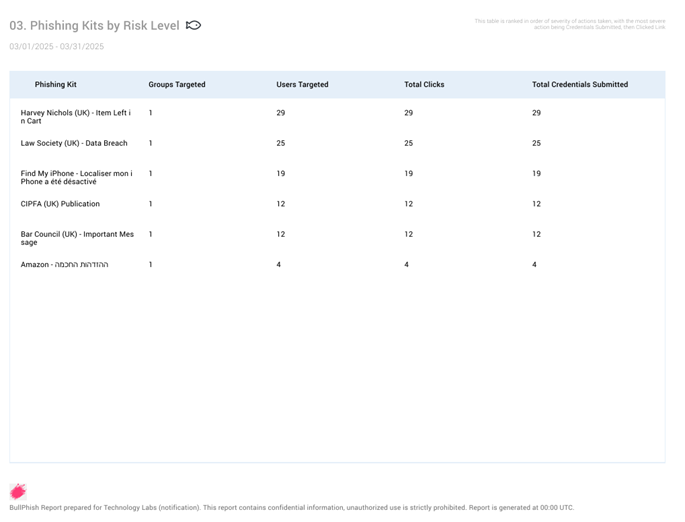
To prevent overly long reports from being generated, the Phishing Kits by Risk Level version is included in the report when there are more than 100 actions taken by targets and 150 or fewer kits sent within the report period. Instead of information being listed for each target, information is presented based on phishing kits. As in the Phished Users version, the actions tracked are Submitted Data and Clicked Link.
The table includes the following data:
- Phishing Kit: Full name of phishing kit in which the action was taken.
- Groups Targeted: Number of groups that were attached to a kit.
- Users Targeted: Number of targets that were attached to a kit.
- Total Clicks: Number of targets that clicked a link.
- Total Credentials Submitted: Number of targets that submitted credentials.
NOTE When there are 100 or more actions taken by targets AND more than 150 kits sent within the report period, a note is displayed under the Phishing Kits by Risk Level section title stating that the maximum of 150 kits is being displayed in the summary.
04. Training & Awareness Details
The information in the Training & Awareness Details section helps your organization track training compliance and identify courses where employees may have had difficulty.
In addition to displaying the percentage for each status, the graph identifies the number of users for each status, as illustrated in this quarterly report example.
Status statistics are broken down and displayed at the campaign level. The Campaigns column lists the campaign name and course name for each campaign. The groups for which the campaign applies are identified as well.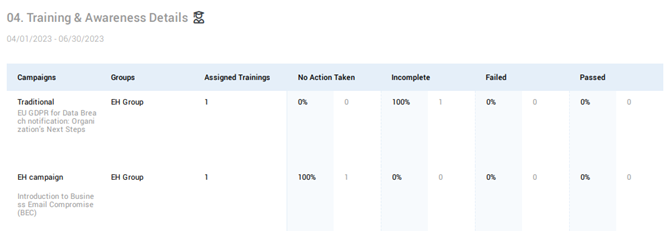
Section 05
To enhance readability and efficiency of Section 5, the version included in the report is based on the number of actions taken by targets and the number of courses within the report period.
- Users by Risk Level: This version appears when there are 100 or fewer actions taken by targets.
- Training Courses by Risk Level: This version appears when there are more than 100 actions taken by targets AND 150 or fewer courses.
Each version is described below.
Users by Risk Level
The Users by Risk Level version is included when there are 100 or fewer actions taken by targets within the report period. In this version, the actions of each target are listed. The actions tracked are Incomplete, No Action, and Failed.
NOTE Passed status is excluded.
The table includes the following data:
- Name: Target's name.
- Training Course Name: Full name of the training course for which the action applies.
- Group: Name of the group to which the training campaign was sent.
- Email: Target's email address.
As indicated in the upper-right corner of the section, table entries are sorted in order of interactivity with the training campaign, starting with the least amount of interactivity. It includes users who took no action, began the training but not finish it (incomplete), and those who failed the training.
The section footer includes the name of the organization for which the report was created. In addition, a statement emphasizes that the report contains confidential information and unauthorized use is strictly prohibited. Each report is generated at midnight UTC.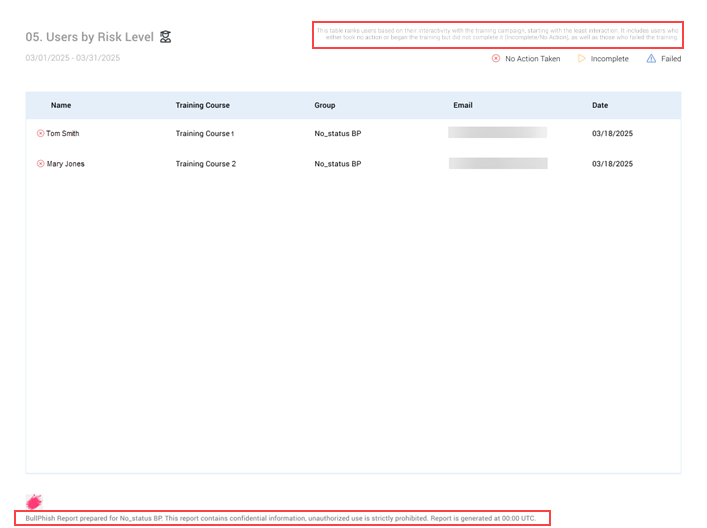
NOTE The sorting criteria and footer information apply to each Section 5 version.
Training Courses by Risk Level
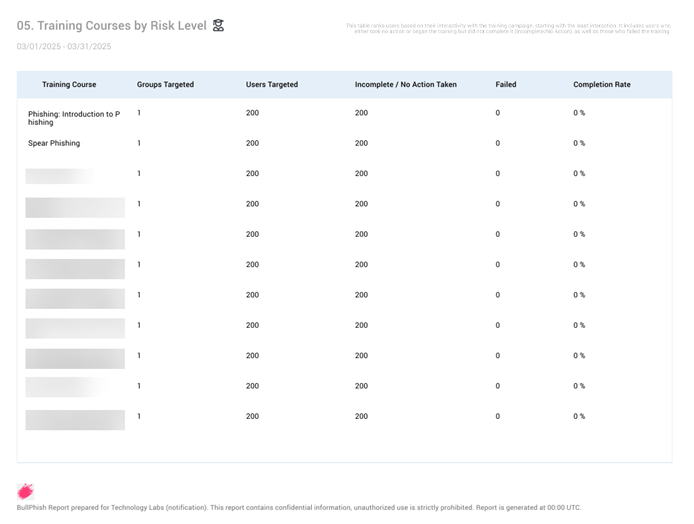
To avoid overly long reports from being generated, the Training Courses by Risk Level version is included in the report when there are more than 100 actions taken by targets AND 150 or fewer courses within the report period. Instead of information being listed for each target, information is presented based on training courses. As in the Users by Risk Level version, the actions tracked are Incomplete, No Action and Failed.
The table includes the following data:
- Training Course Name: Full name of the training course for which the action applies.
- Groups Targeted: Number of groups that were attached to a course.
- Users Targeted: Number of targets that were attached to a course.
- Incomplete/No Action: Number of targets that started the training but did not finish it (incomplete) or took no action on the course.
- Failed: Number of targets that failed the training.
- Completion Rate: Percentage of targets that completed the training course out of the total number of targets that participated in the course (for more information, see the Complete Rate column section below).
Completion Rate column
The Completion Rate column displays the percentage of targets that completed the training course out of the total number of targets that participated in the course.
A course is considered completed when the user has passed or failed the course.
A target is considered to have participated in a training course when they have completed the course (passed/failed) or have started the course but did not finish it (incomplete).
The completion rate for a course is calculated by dividing the total number of targets that completed the course by the total number of targets that participated in the course, then multiplying the result by 100%.
Completion rate = (# of targets completed course/ # of targets participated in course) * 100
EXAMPLE 9 targets completed the PHI training course. A total of 10 targets participated in the course. The formula to calculate the completion rate for the course is (9 / 10) * 100.
9/10 = .9
.9 * 100 = 90
The course's completion rate is 90%.
NOTE When there are more than 100 actions taken by targets AND 150 or more courses within the report period, a note is displayed under the Training Courses by Risk Level section title stating that the maximum of 150 courses is being displayed in the summary. 
Incomplete/No Action Taken scenarios
In the following scenarios, the number in the Incomplete/No Action Taken column may be higher than the number in the Users Targeted column.
- If a campaign is recreated within the reporting period and includes targets from the original campaign.
- Within the reporting period, if a new campaign is created that includes the same course from another campaign and includes some of the same targets in both campaigns.
In this example, there were 200 Users Targeted in the Spear Phishing campaign. The Incomplete/No Action Taken column shows a value of 202. This means that there were two users from the original campaign that were also targets in the new/recreated campaign and have an Incomplete/No Action Taken status for both campaigns.
06. Remedial Training Details
When Auto-Enrollment for High-Risk Targets is enabled, users who fail phishing simulations are automatically enrolled in remedial training campaigns after the phishing campaign ends. The Remedial Training Details section of the business report provides visibility into remedial training compliance across your organization.
Users who fail phishing simulations are labeled as High-Risk Users in the report. Only campaigns with activity during the selected reporting period are included.
In the graph, Total High-Risk Users represents the number of unique individuals who failed phishing simulations during the reporting period.
Each status includes both the percentage and the number of users, as illustrated in this monthly report example.
The status values are described below:
- No Action taken: Users either did not open the remedial training emails they received or opened them but took no action.
- Incomplete: Users started but did not complete the remedial training course.
- Failed: Users finished the remedial training course but did not pass.
- Passed: Users finished and passed the remedial training course.
Status statistics are displayed at the campaign level in the table. The Course Name column lists the name of the assigned course followed by the campaign name. The High-Risk User Enrollments column indicates how many users were enrolled in each remedial training campaign. A user may appear in multiple campaigns if they failed more than one phishing simulation.
Each status includes the number and percentage of users.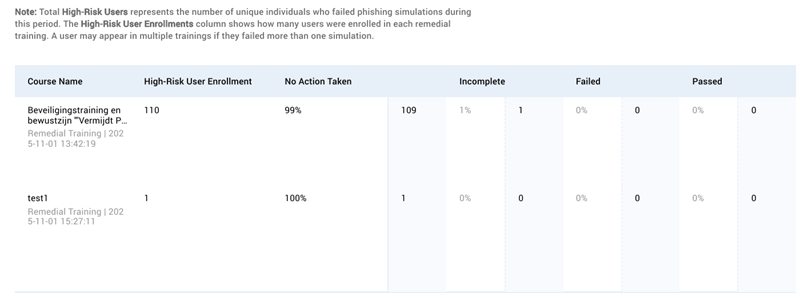
NOTE When there are more than 150 remedial campaigns within a reporting period, a message is displayed in the upper-left corner of the report page indicating that to ensure readability and performance, a maximum of 150 campaigns is displayed.
A user report contains campaign status information for each user to which a campaign applies. The report data is based on campaigns that were in progress or completed during a selected date range. Separate phishing and training user reports can be generated and downloaded as a CSV file.
The first and second columns in a user report identify the names and email addresses of each target, respectively. The user's role in the organization is displayed in the Position column. A column is displayed for each campaign in the report. Each campaign column heading identifies the name of the phishing kit or training course, the campaign name, and the date & time the campaign was created. The time zone is abbreviated (e.g., PST) if an abbreviation exists. If there is not an abbreviation, the full name of the time zone is displayed.
NOTE The training user report includes a Completion Rate column, described in the Training report section below.
Phishing report
Campaign status values
A phishing report includes the campaign status for each target. The status values are:
- Sent: The phishing campaign email was sent to the user but the user did not open it.
- Email Opened: The user opened the phishing campaign email but did not click any links (i.e., landing page link, attachment).
- Clicked Link: User opened the phishing campaign email and clicked a link (i.e., landing page link, attachment).
- Submitted Data: User opened the phishing campaign email, clicked the link to the landing page, and submitted data (e.g., login credentials)
NOTE A hyphen (-) indicates the user was not a target in the campaign.
Training report
Campaign status values
A training report contains the campaign status for each target. The status values are:
- Sent: The training campaign email was sent to the user but the user did not open it.
- Opened Email: The user opened the training campaign email but did not click the link to the training portal.
- Opened Training: The user opened the training campaign email, clicked the link to the training portal, and opened the training course.
- Completed Training: The user opened the training campaign email, clicked the link to the training portal, and finished the training course with a Completed or Failed status.
Completion Rate column
The Completion Rate column displays the percentage of training courses a user has completed out of the total number of courses for which the user has participated.
A course is considered completed when the user has passed or failed the course.
A user is considered to have participated in a training course under the following statuses: Not Sent (user can still access the course in the portal), Sent, Opened Email, Opened Training, Pending Resend.
A user's completion rate is calculated by dividing the total number of courses completed by the total number of courses participated, then multiplying the result by 100%.
Completion rate = (# of courses completed / # of courses participated) * 100
EXAMPLE Tom is assigned 10 training courses. He passes seven courses, fails two, and has one incomplete course. Tom has completed a total of nine courses out of the total of 10 in which he has participated. The formula to calculate his completion rate is (9 / 10) * 100.
9/10 = .9
.9 * 100 = 90
Tom's completion rate is 90%.
NOTE A hyphen (-) indicates the user was not a target in the campaign.
Remedial training campaigns
Remedial training campaign data is included in user training reports when at least one remedial training campaign occurs within the selected reporting period. The user training report displays campaign status information for each user to whom a remedial training campaign applies.
EXAMPLE Training user report with remedial training campaign 
In the Reporting module, you can automate the creation and delivery of reports. For more information, see the article Automate business reports and user reports
How to...
- In the navigation menu, select Reporting > Export Report.
- The Business tab is selected automatically.
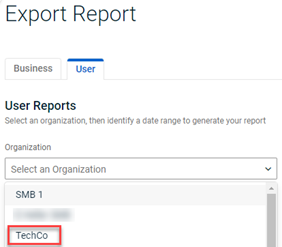
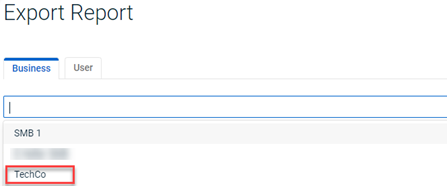
- In the SMB organization list, select an organization.
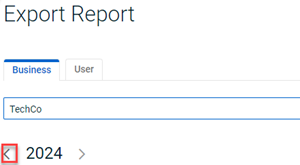
- If necessary, click the navigation arrows to select the year desired.
- To download a monthly or quarterly report, click its Download link.

NOTE Business reports are exported in PDF format only.
- In the navigation menu, select Reporting > Export Report.
- Click the User tab.
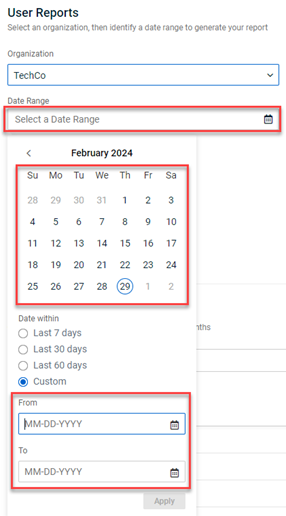
- In the User Reports section:
- In the Report Contents section, select the check box for the type of user report, Phishing and/or Training, you want to export.
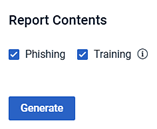
NOTE If you select Phishing and Training, a separate user report will be generated for each.
NOTE The tooltip next to the Training option indicates that remedial training campaign information is automatically included in the user report along with standard training campaign data.
- Click the Generate button.
- The reports are listed in the Report Log table. The Status field shows the report is Generating.

- Click the Refresh button or reload the page and the Status field should indicate Completed.

- Hover in the far right column for the report and click the Download icon.

NOTE A user report is available exclusively to the user that generates it. Six months after a report is generated, it is automatically deleted.
| Revision | Date |
|---|---|
| Business report content revised. Added User report content. | 10/19/23 |
| Phishing Status descriptions: Added Note: Submit button is only link tracked on landing page. | 1/17/24 |
| 03 Section: Phished Users version: Opened Email action no longer tracked. Campaign column replaced with Phishing Kit column. New Phishing Kits by Risk Level version added.
05 Section: Users by Risk Level version: Passed status no longer tracked. Campaign column replaced with Training Course column. New Training Courses by Risk Level version added. |
4/7/25 |
| Added remedial campaign info. | 9/25/25 |
| Edited training status No Action taken: The percentage of users who opened the training campaign emails they received but took no action. | 9/26/25 |
| Added section 06. Remedial Training Details. | 11/27/25 |
| Added Remedial training campaigns section. PR: User Reports - Step 4 - Added tooltip description note. | 1/22/26 |
